Australia has been described as a land of opportunity, attracting immigrants from around the world. People arrive with the belief that hard work will be rewarded with improvements to their lives, which they hope will translate into better chances for their children.
But do all immigrant groups in Australia, and their children, have the same chances? Immigrants are not a homogenous group – their possessions, aspirations, and obstacles are unique. All of these factors not only give immigrants different starting points in Australia but also have an influence on their Australian-born children as well. I’m a product of these immigration dynamics myself, which made me interested to delve deeper into the census data around the issue.
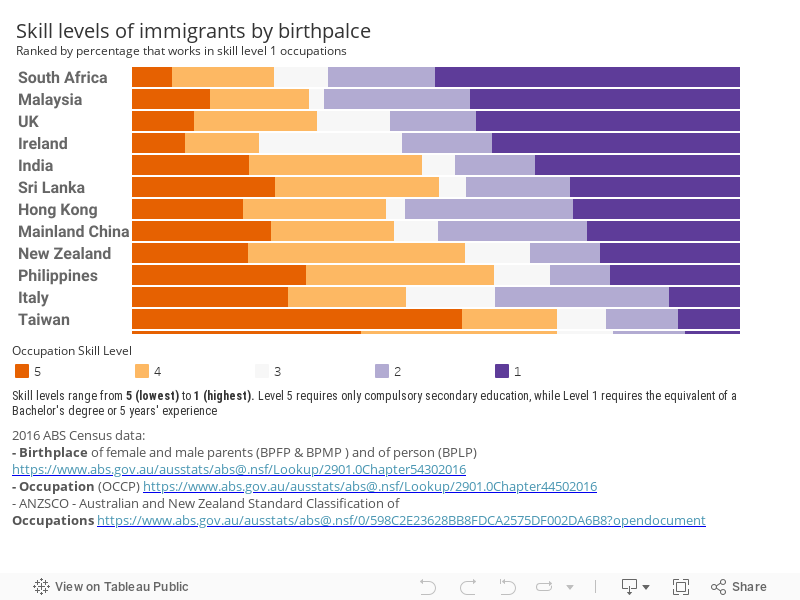
Skilled and unskilled jobs
Australian jobs are divided into 5 ‘skill levels’, based on ANZCO (the Australian and New Zealand Standard Classification of Occupations). But it’s not all about university degrees and formal education – the levels also take into account other training and experience required. For example engineering managers are designated the highest skill level of 1, but so are many farmers (that’s not a job that just anyone can do). Level 1 occupations require “a level of skill commensurate with a Bachelor degree or higher qualification” or “at least five years of relevant experience”.
The Commonwealth Effect
Immigrants from past and current Commonwealth countries (the UK and former territories fo the British Empire) have a noticeable advantage in obtaining high-skilled employment. We haven’t isolated this factor and ruled out other influences, but it’s a noticeable pattern with some possible explanations.
English is spoken or heavily emphasised in education in most parts of the Commonwealth, and in general qualifications are more easily transferred between Commonwealth countries. It’s very likely that English language fluency as well as transferred skills have helped these immigrants in Australia.
The exception to this pattern is New Zealand, which doesn’t seem to enjoy this privilege. Perhaps the lifestyle appeal of Australia, a very similar country, to highly skilled New Zealanders just isn’t enough to make them cross the Tasman.

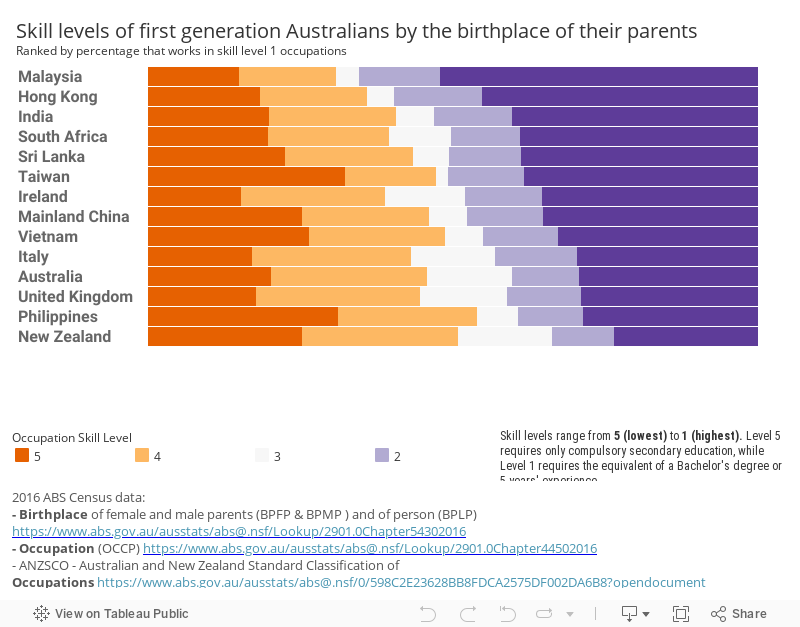
Children of immigrants: high achievers from Asia
Immigrants from Malaysia, Hong Kong and India stand out in terms of how many of their Australian-born children end up in a high skilled occupation.
On the other hand immigrants from Taiwan, Vietnam and Italy have the highest upward mobility, measured by the increase in skill level 1 (high skill) occupations between immigrants and their children.

A steady stream from the ‘mother country’ versus ebb and flow from China
The charts below show the different skill levels of immigrants from China and the United Kingdom over time, divided by age group (vertical axis). The triangular shape simply reflects mortality – of those arriving in the 1960s for example, only people who were teenagers at the time are still alive. The larger the dots, the more immigrants in that group.
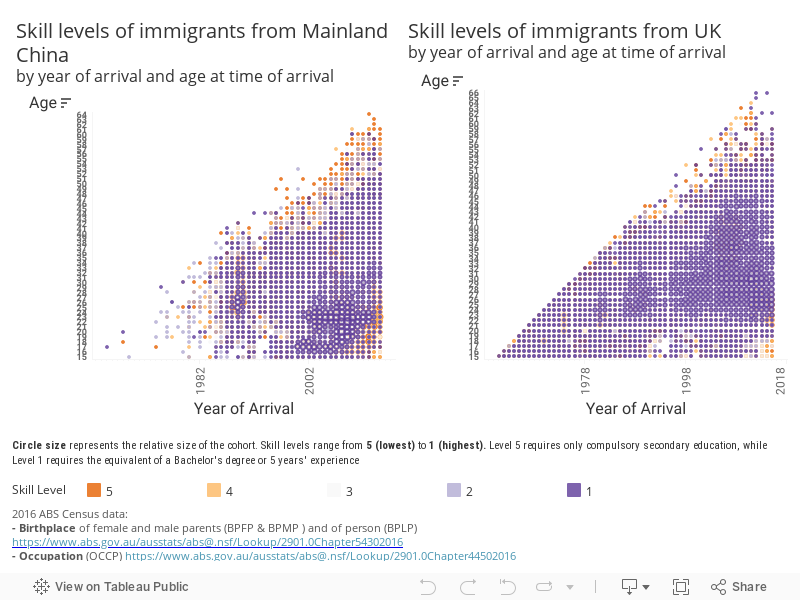

You can see some clear differences between the immigration patterns from the two countries. The first is in the continuity of the graph – there is very steady immigration from the UK (reflected in the regular shape of the chart), whereas China’s graph shows much more ebb and flow. There was little Chinese migration to Australia in the early-mid 20th Century, largely a result of the White Australia policy which was only gradually dismantled from 1949-1973. A large clump can be seen around 1989, those people who stayed in Australia following the domestic upheaval.
Another difference is in the patterns of skilled and unskilled work. Immigrants from the UK have a higher percentage of skilled employment, and typically emigrate between the ages of 25-45, when they are likely to have established careers. Chinese migration skews much younger – since 2000, many people have arrived under the age of 25, the majority probably students. This cohort forms a block of low-skilled employment (likely while studying), which generally transitions to high-skilled employment by age 25. Older Chinese immigrants also form a group of more low-skilled workers, with language barriers likely an issue.
For a better life
The next three charts show immigration patterns from Vietnam, the Philippines and South Africa:

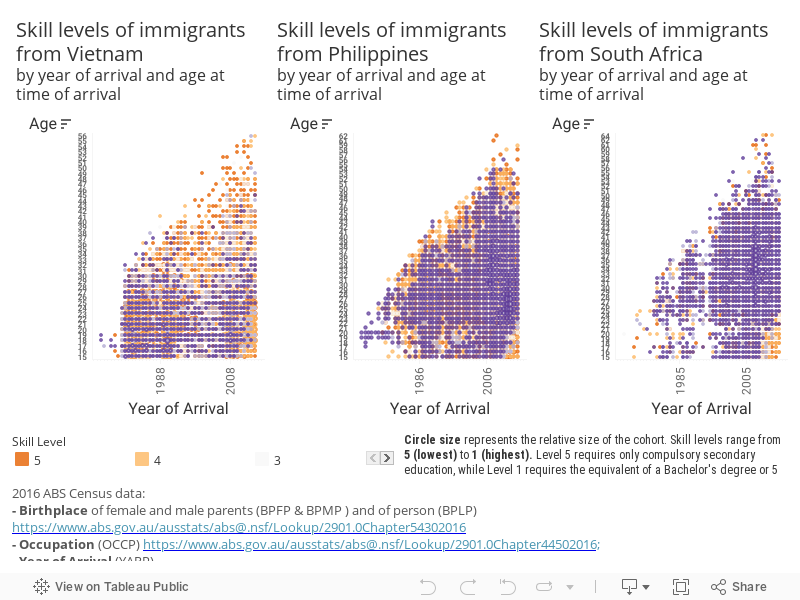
Vietnam
On 26 April 1976, the first boat carrying Vietnamese refugees arrived in Darwin harbour following the Vietnam War. Up until 1975, there had been less than 2000 Vietnamese-born people living in Australia. A small number of refugees arrived in 1976-77, but numbers increased dramatically in 1978, as our chart shows. By 1985, 70,000 refugees from Southeast Asia, mostly Vietnam, had settled in Australia.
Philippines
With the end of the White Australia Policy in 1973, Filipino immigration was no longer restricted, and the declaration of martial law in the Philippines during the previous year caused many to seek a new life in Australia. Between 1981 and 2016 there is a noticeable increase in the migration of Filipino spouses and fiancées under the Family Reunion Program.
South Africa
Many South Africans left the country following the election of Nelson Mandela in 1994, a trend clearly visible in the chart. This behaviour was stigmatised in South Africa as “Packing for Perth” (PFP), a joke that both referenced the Progressive Federal Party and its majority-white supporters, and tipped its hat to Australia as one of the top destinations for South Africans emigrating overseas. There has been consistently high levels of emigration among educated South Africans ever since, not just white citizens but people of all ethnicities. While far from being at crisis proportions, it’s often noted and debated, with crime frequently cited as a factor.
If you are interested in knowing more about Australia’s immigrant communities through the lens of data, head over to Small Multiples website for maps and visualisations such as: