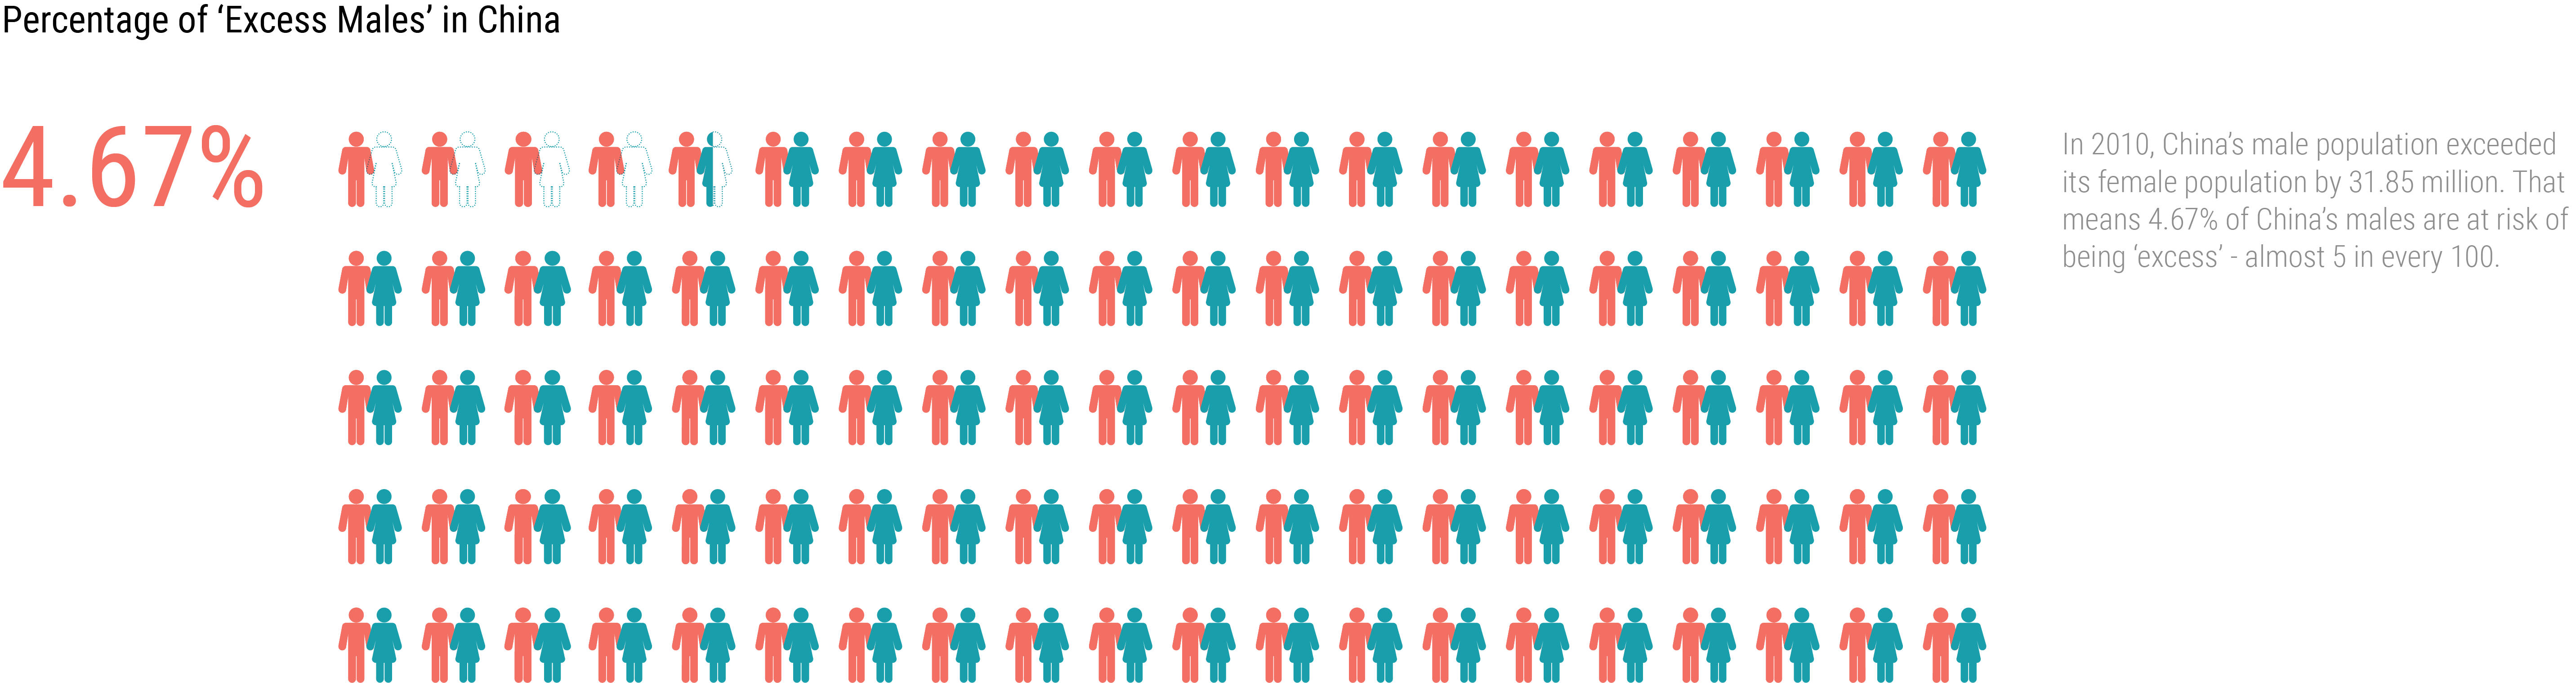
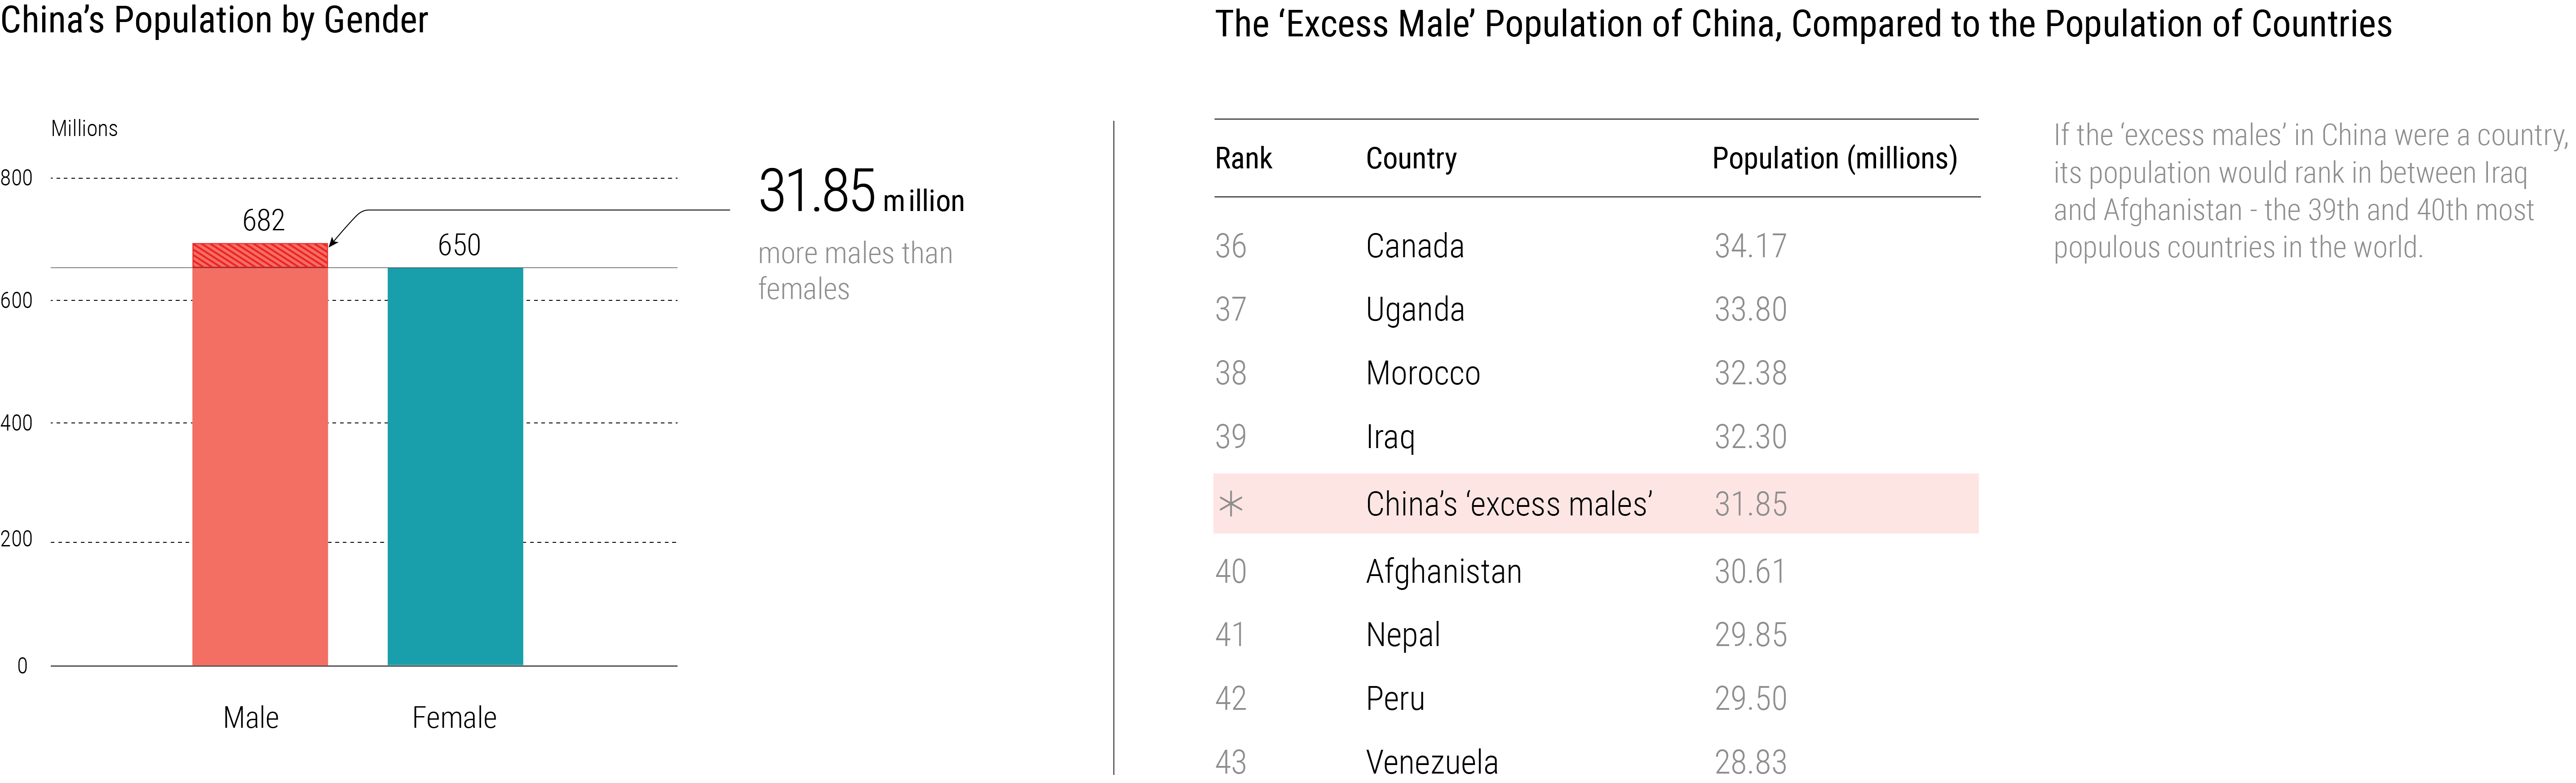
In mainland China, men outnumber women by almost 32 million. That’s a group of people larger than Australia and New Zealand combined, who will never find a wife (presuming that’s what they’re looking for). This imbalance has been linked to loneliness and depression among men, as well as trafficking of brides from surrounding countries such as Vietnam and Cambodia.
Here’s what that looks like on a map. Areas with more men (over 100 males per hundred females) are coloured red, those with more women are coloured blue:
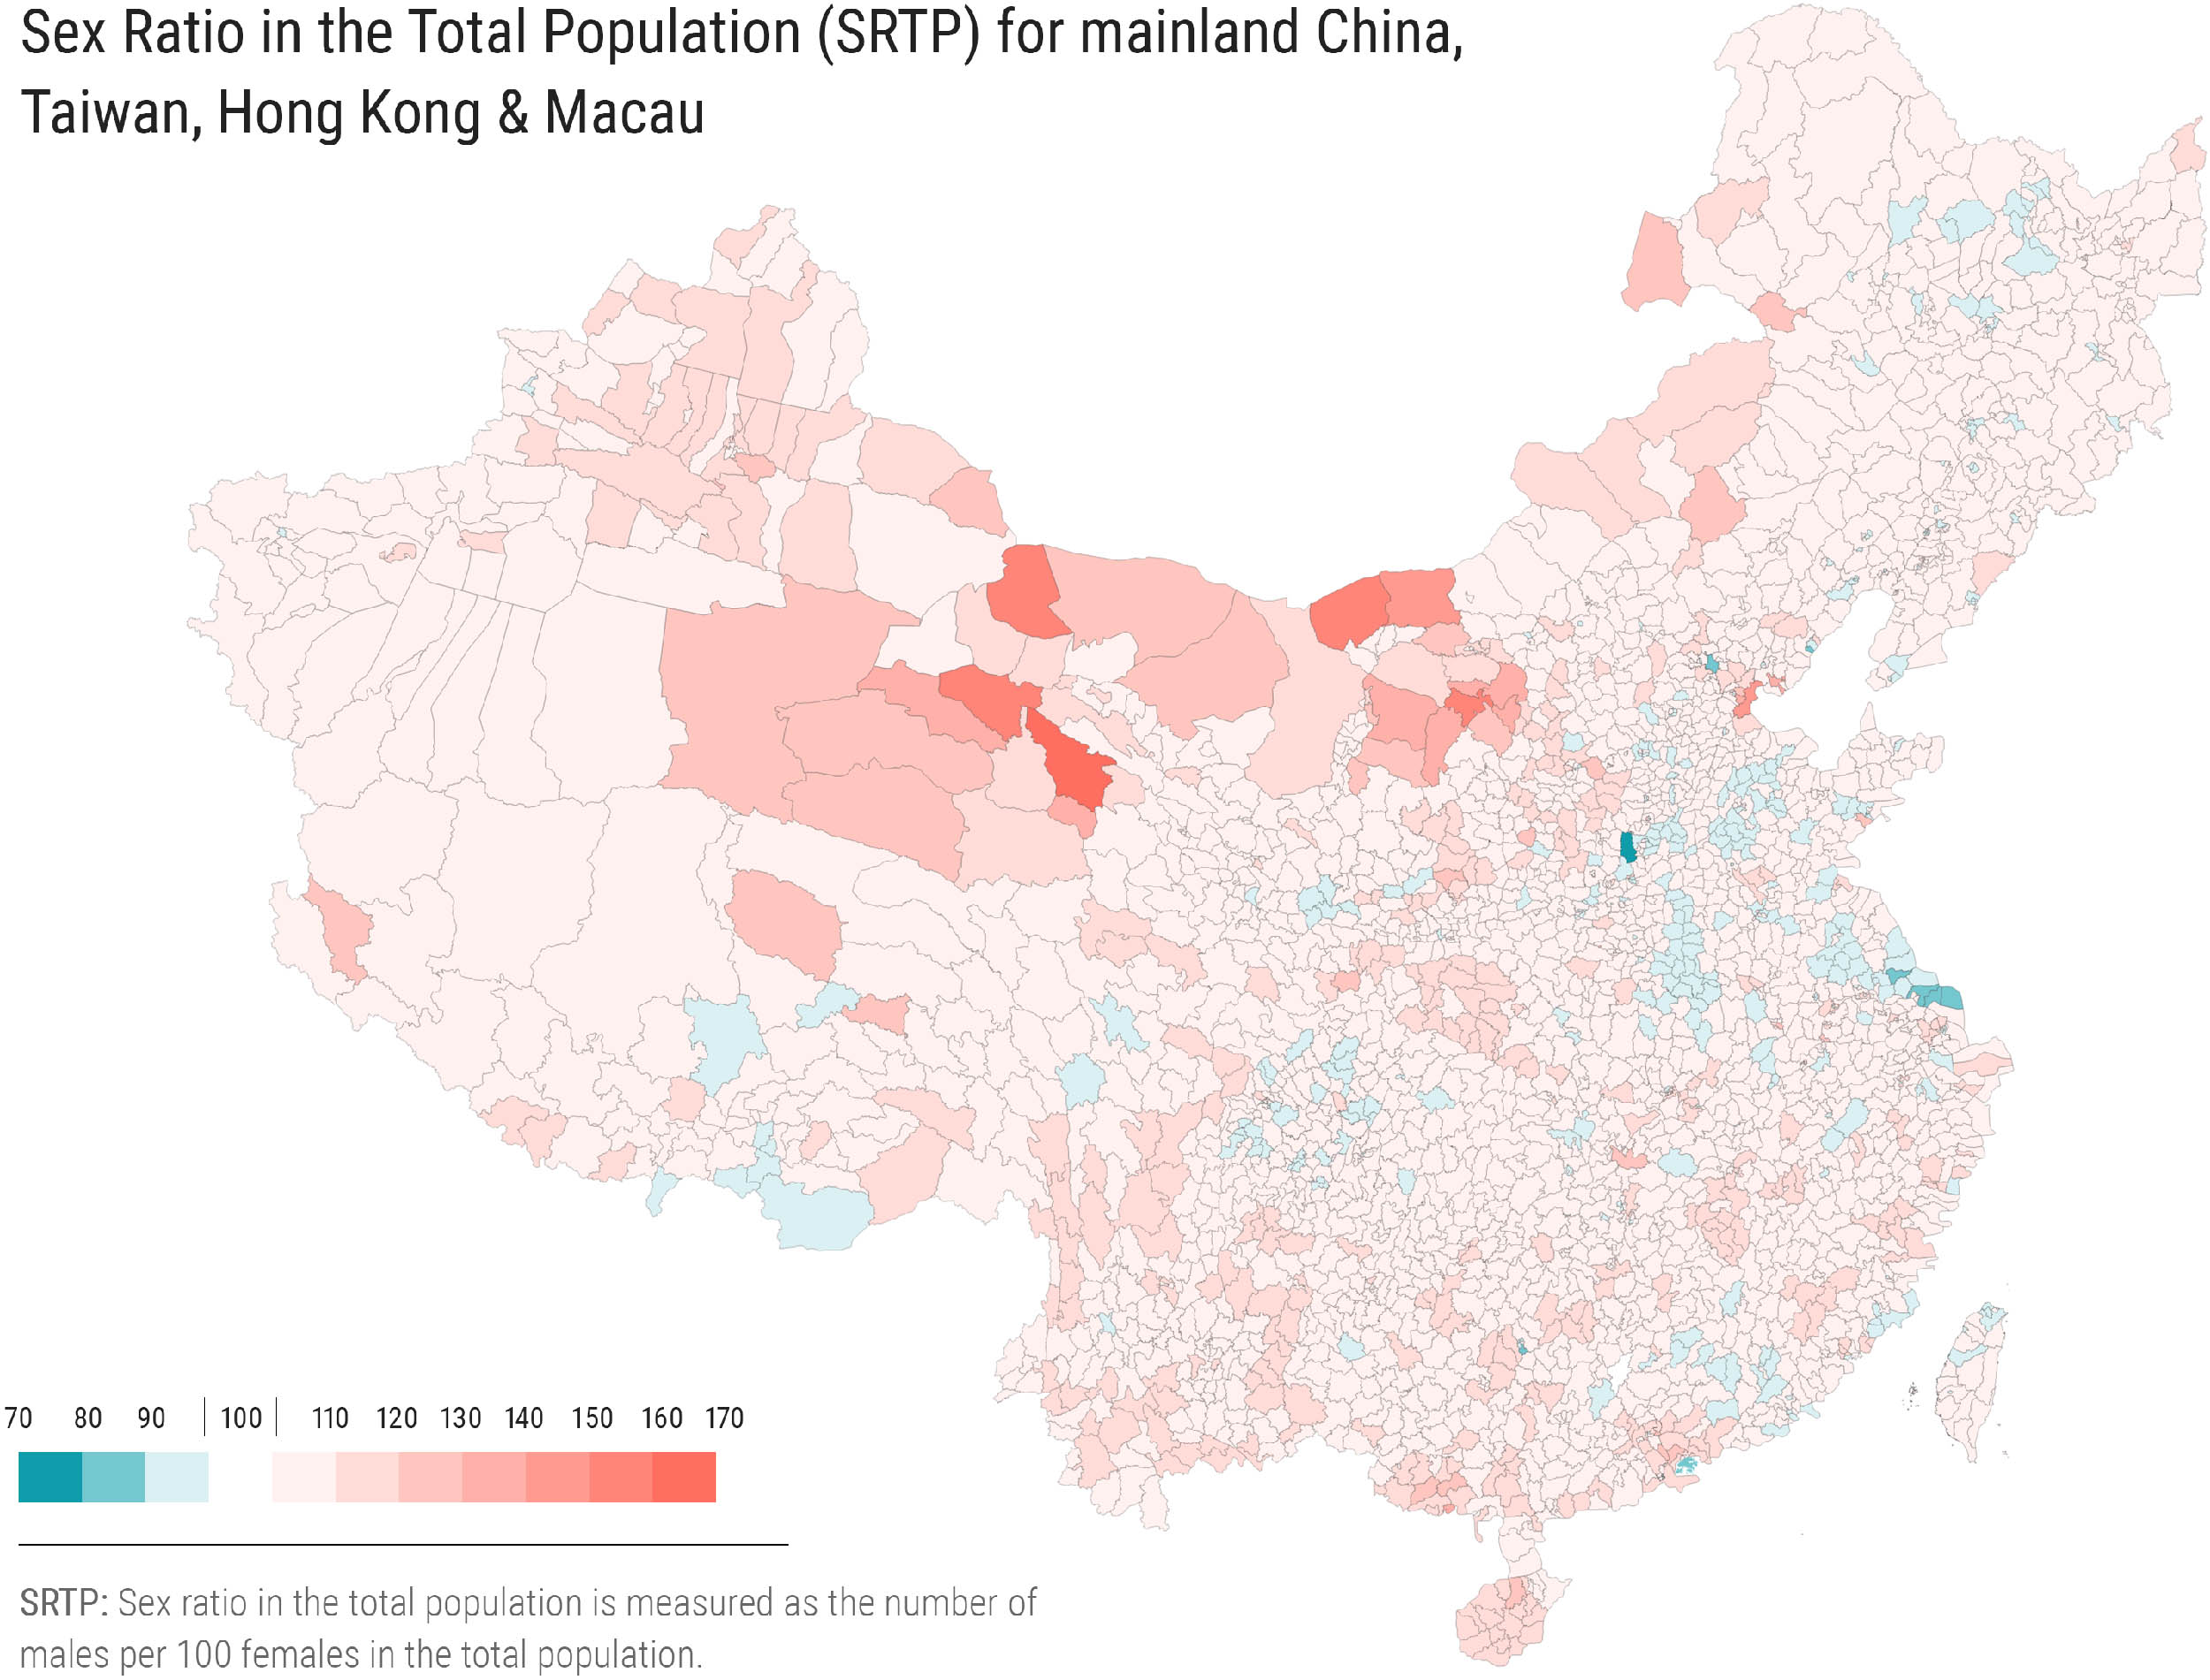
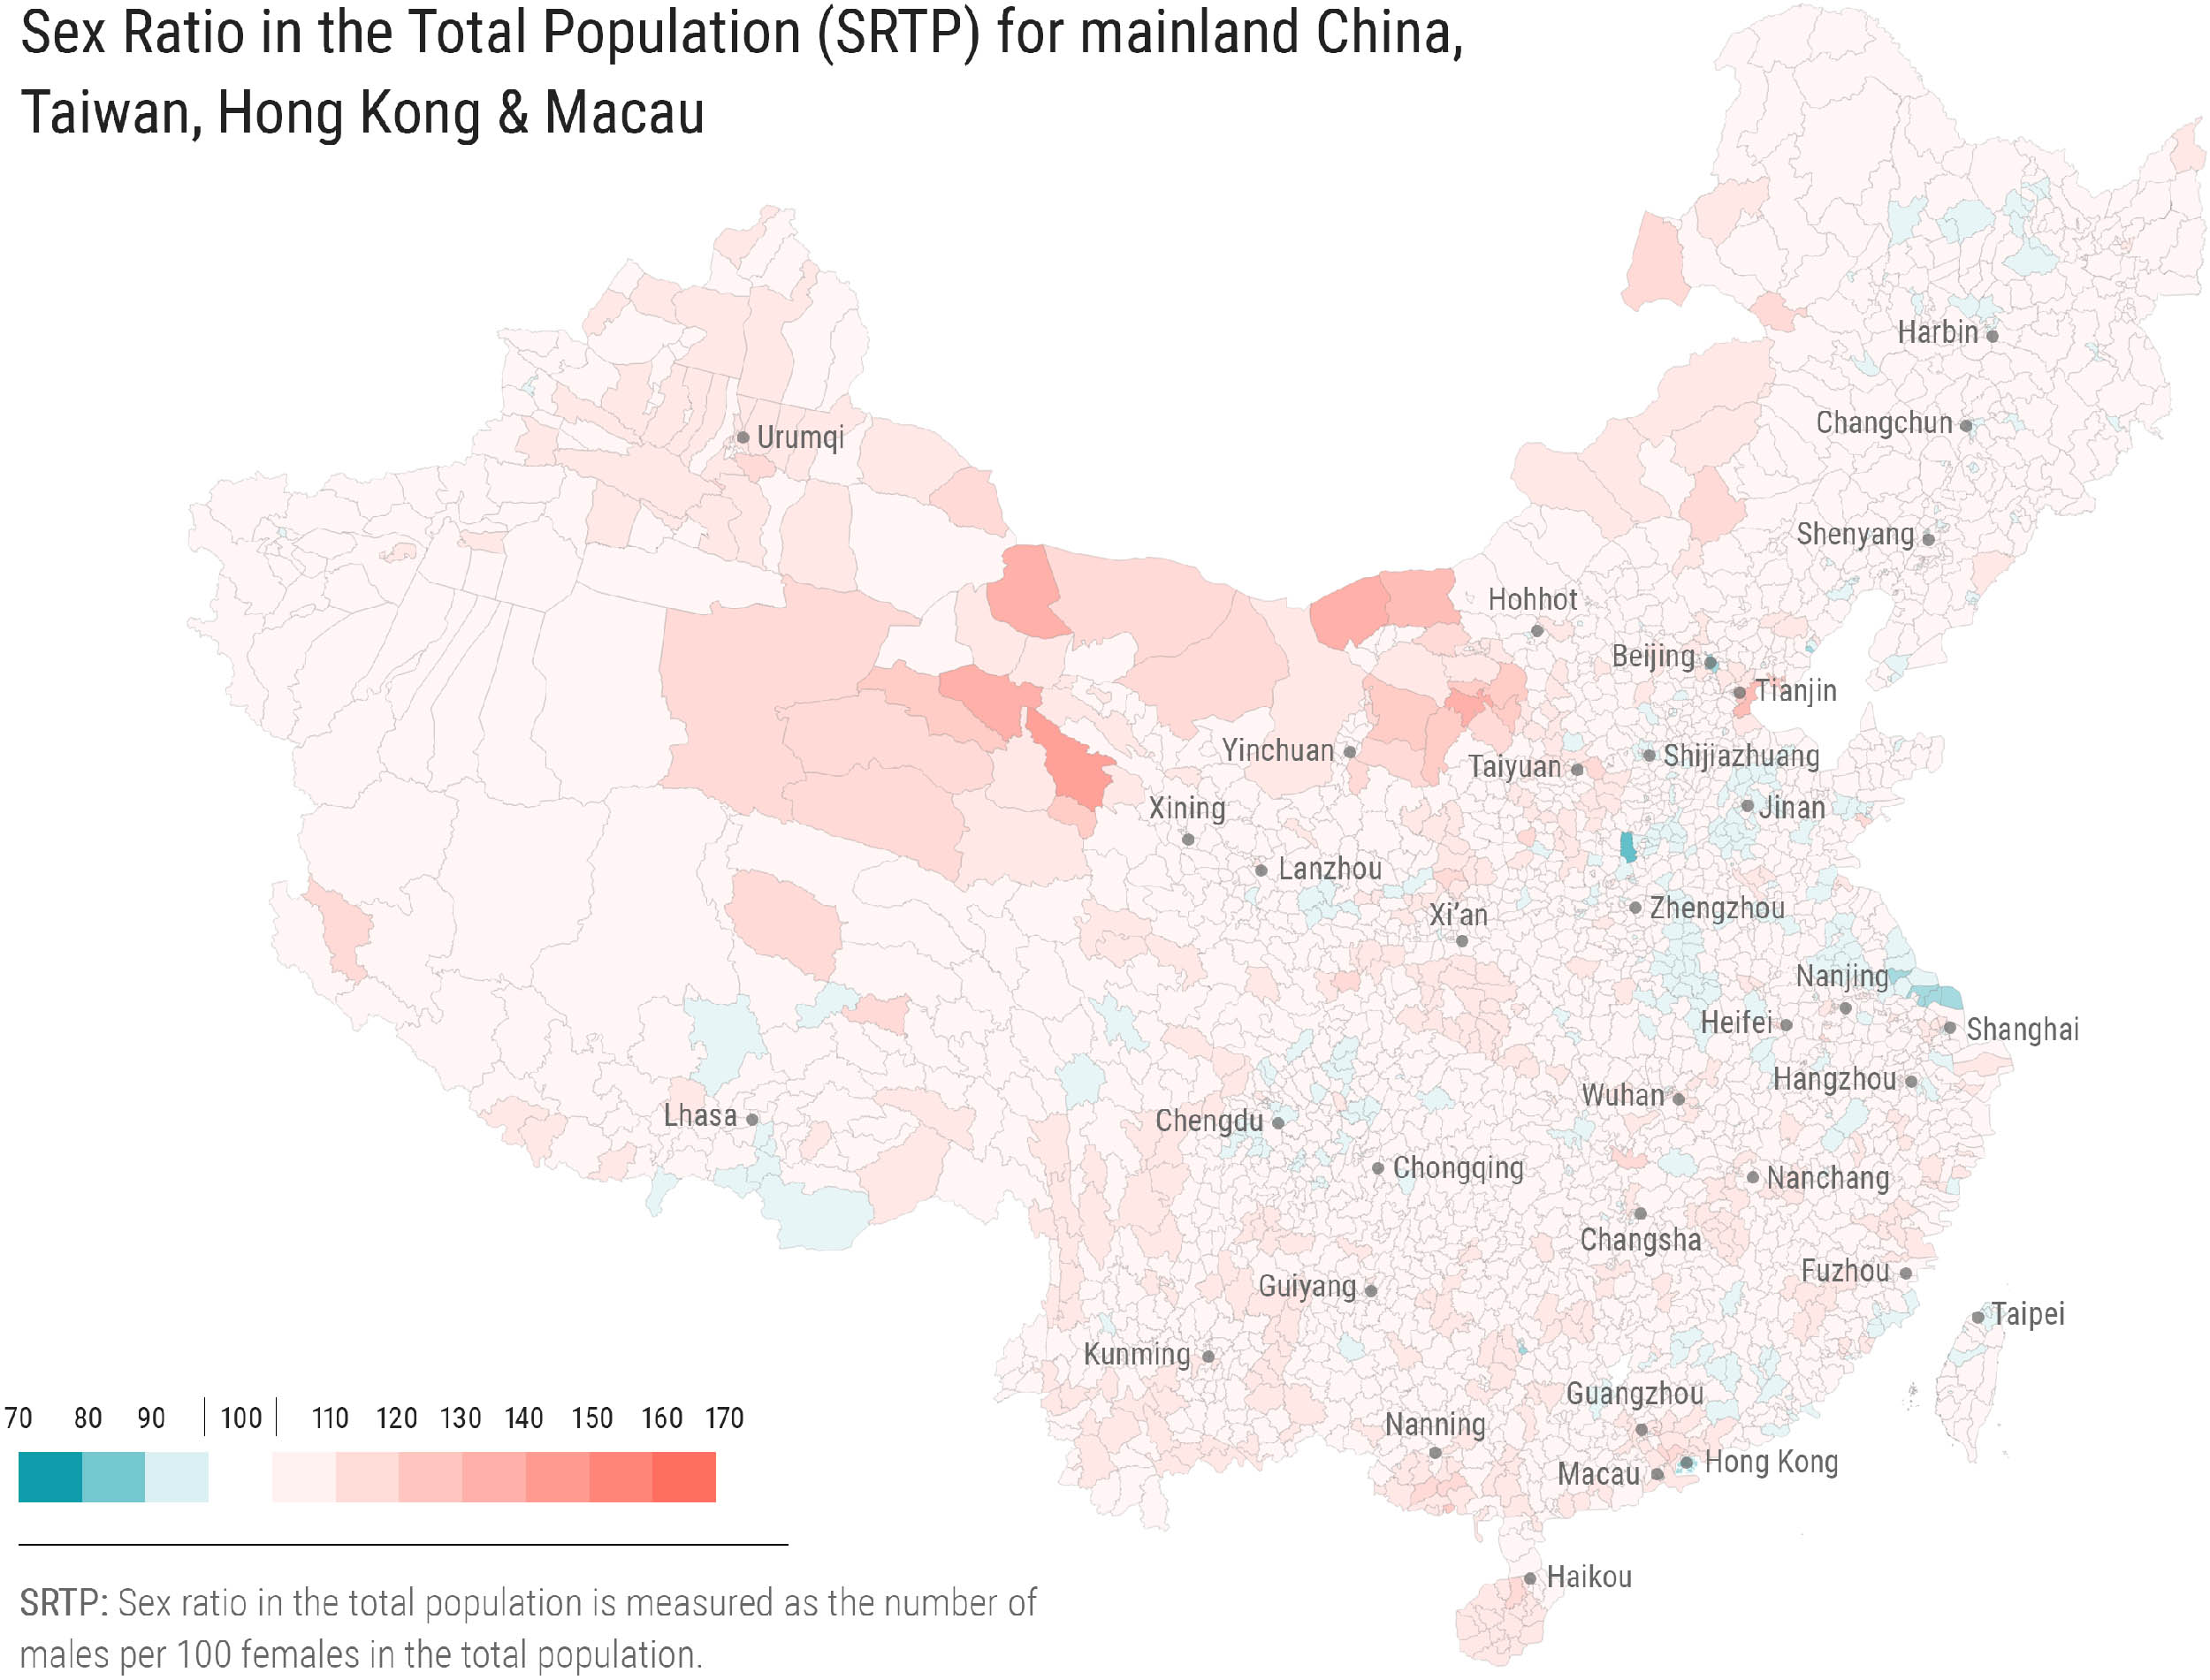
Display capital cities
We were able to map this data at a county level, including the 2,851 county-level divisions of mainland China, 13 in Taiwan, one for Hong Kong and one for Macau. As far as we’re aware, this is the most detailed public map of sex ratios in the region ever created. The data isn’t easily found online, but we were able to piece it together with data from the Chinese Population Census Office, the National Statistics Bureau of Taiwan, the Census and Statistics Department of Hong Kong, and the Statistics and Census Service of Macau.
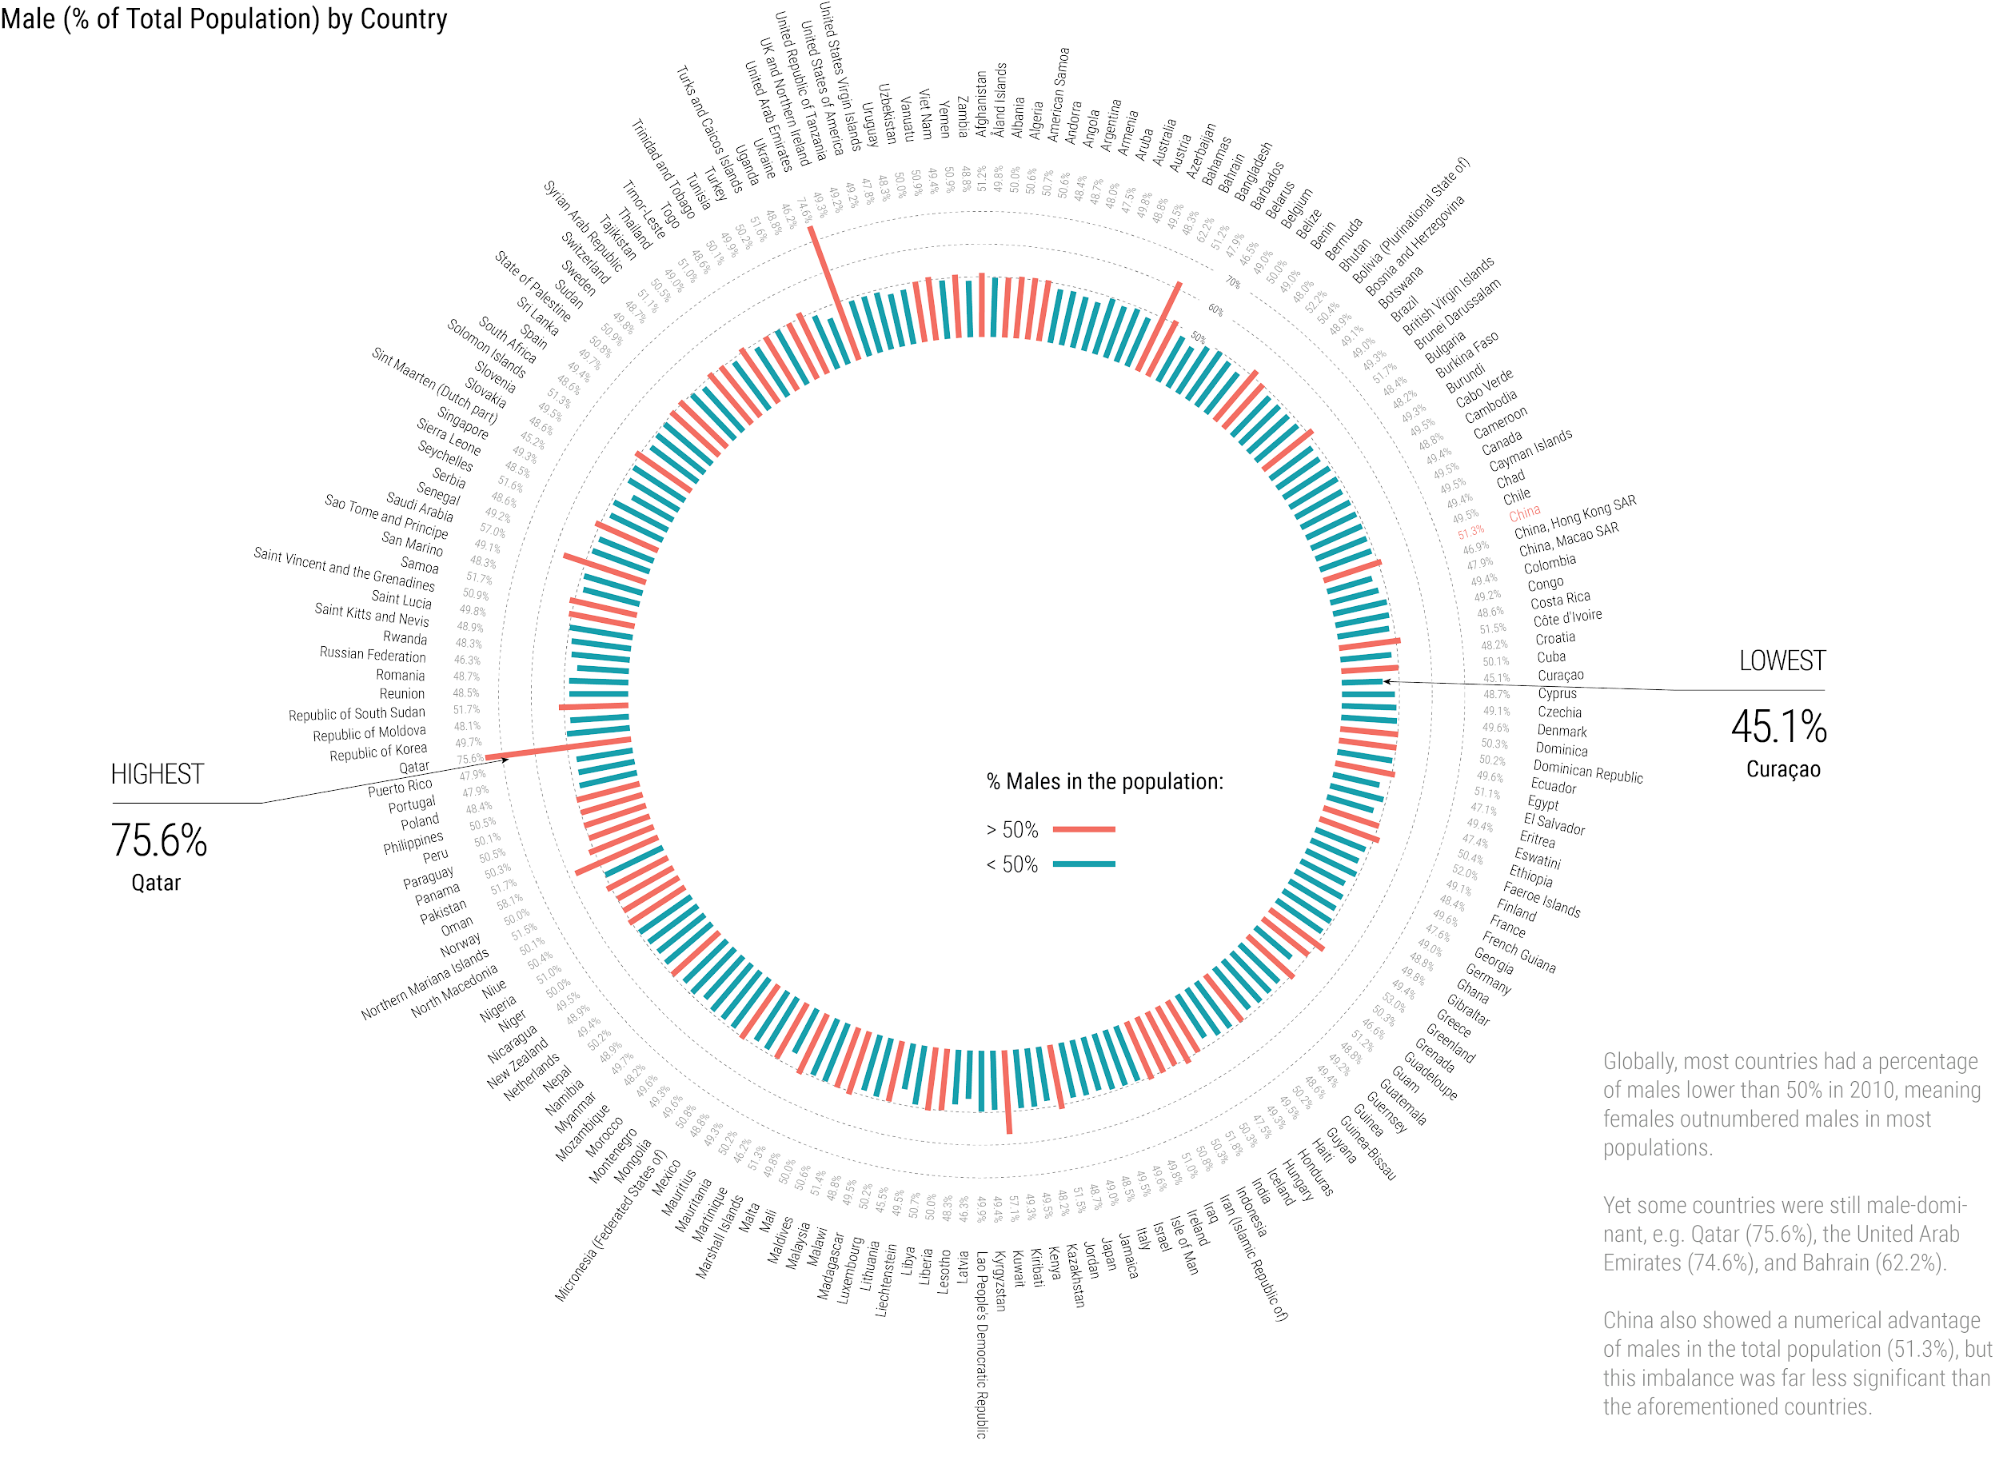
To put this sex disparity into context, most countries in the world have more women than men. Nature has this fairly well sorted: male birth rates are higher on average (around 105 boys to 100 girls), but this difference is eroded over time as men die earlier. According to the CIA World Factbook, of 230 countries and self-governing regions in the world, 134 have more women than men, 20 are around equal, and 76 have more men than women.
(Click to enlarge)
That said, there are still slightly more men in the world than women (a ratio of around 101:100). This figure is influenced by the fact that the world’s two largest countries, the People’s Republic of China and India, have very skewed sex ratios. China’s is estimated at between 104.9 (2010 Chinese census, the same source as this article) and 106 (2018 CIA World Factbook estimate), while India’s is around 107 (2011 Census). Australia, by contrast, had a ratio of 99.2 at a comparable time, i.e. more women than men (2010 Australian Bureau of Statistics data). Where do these skewed ratios come from?
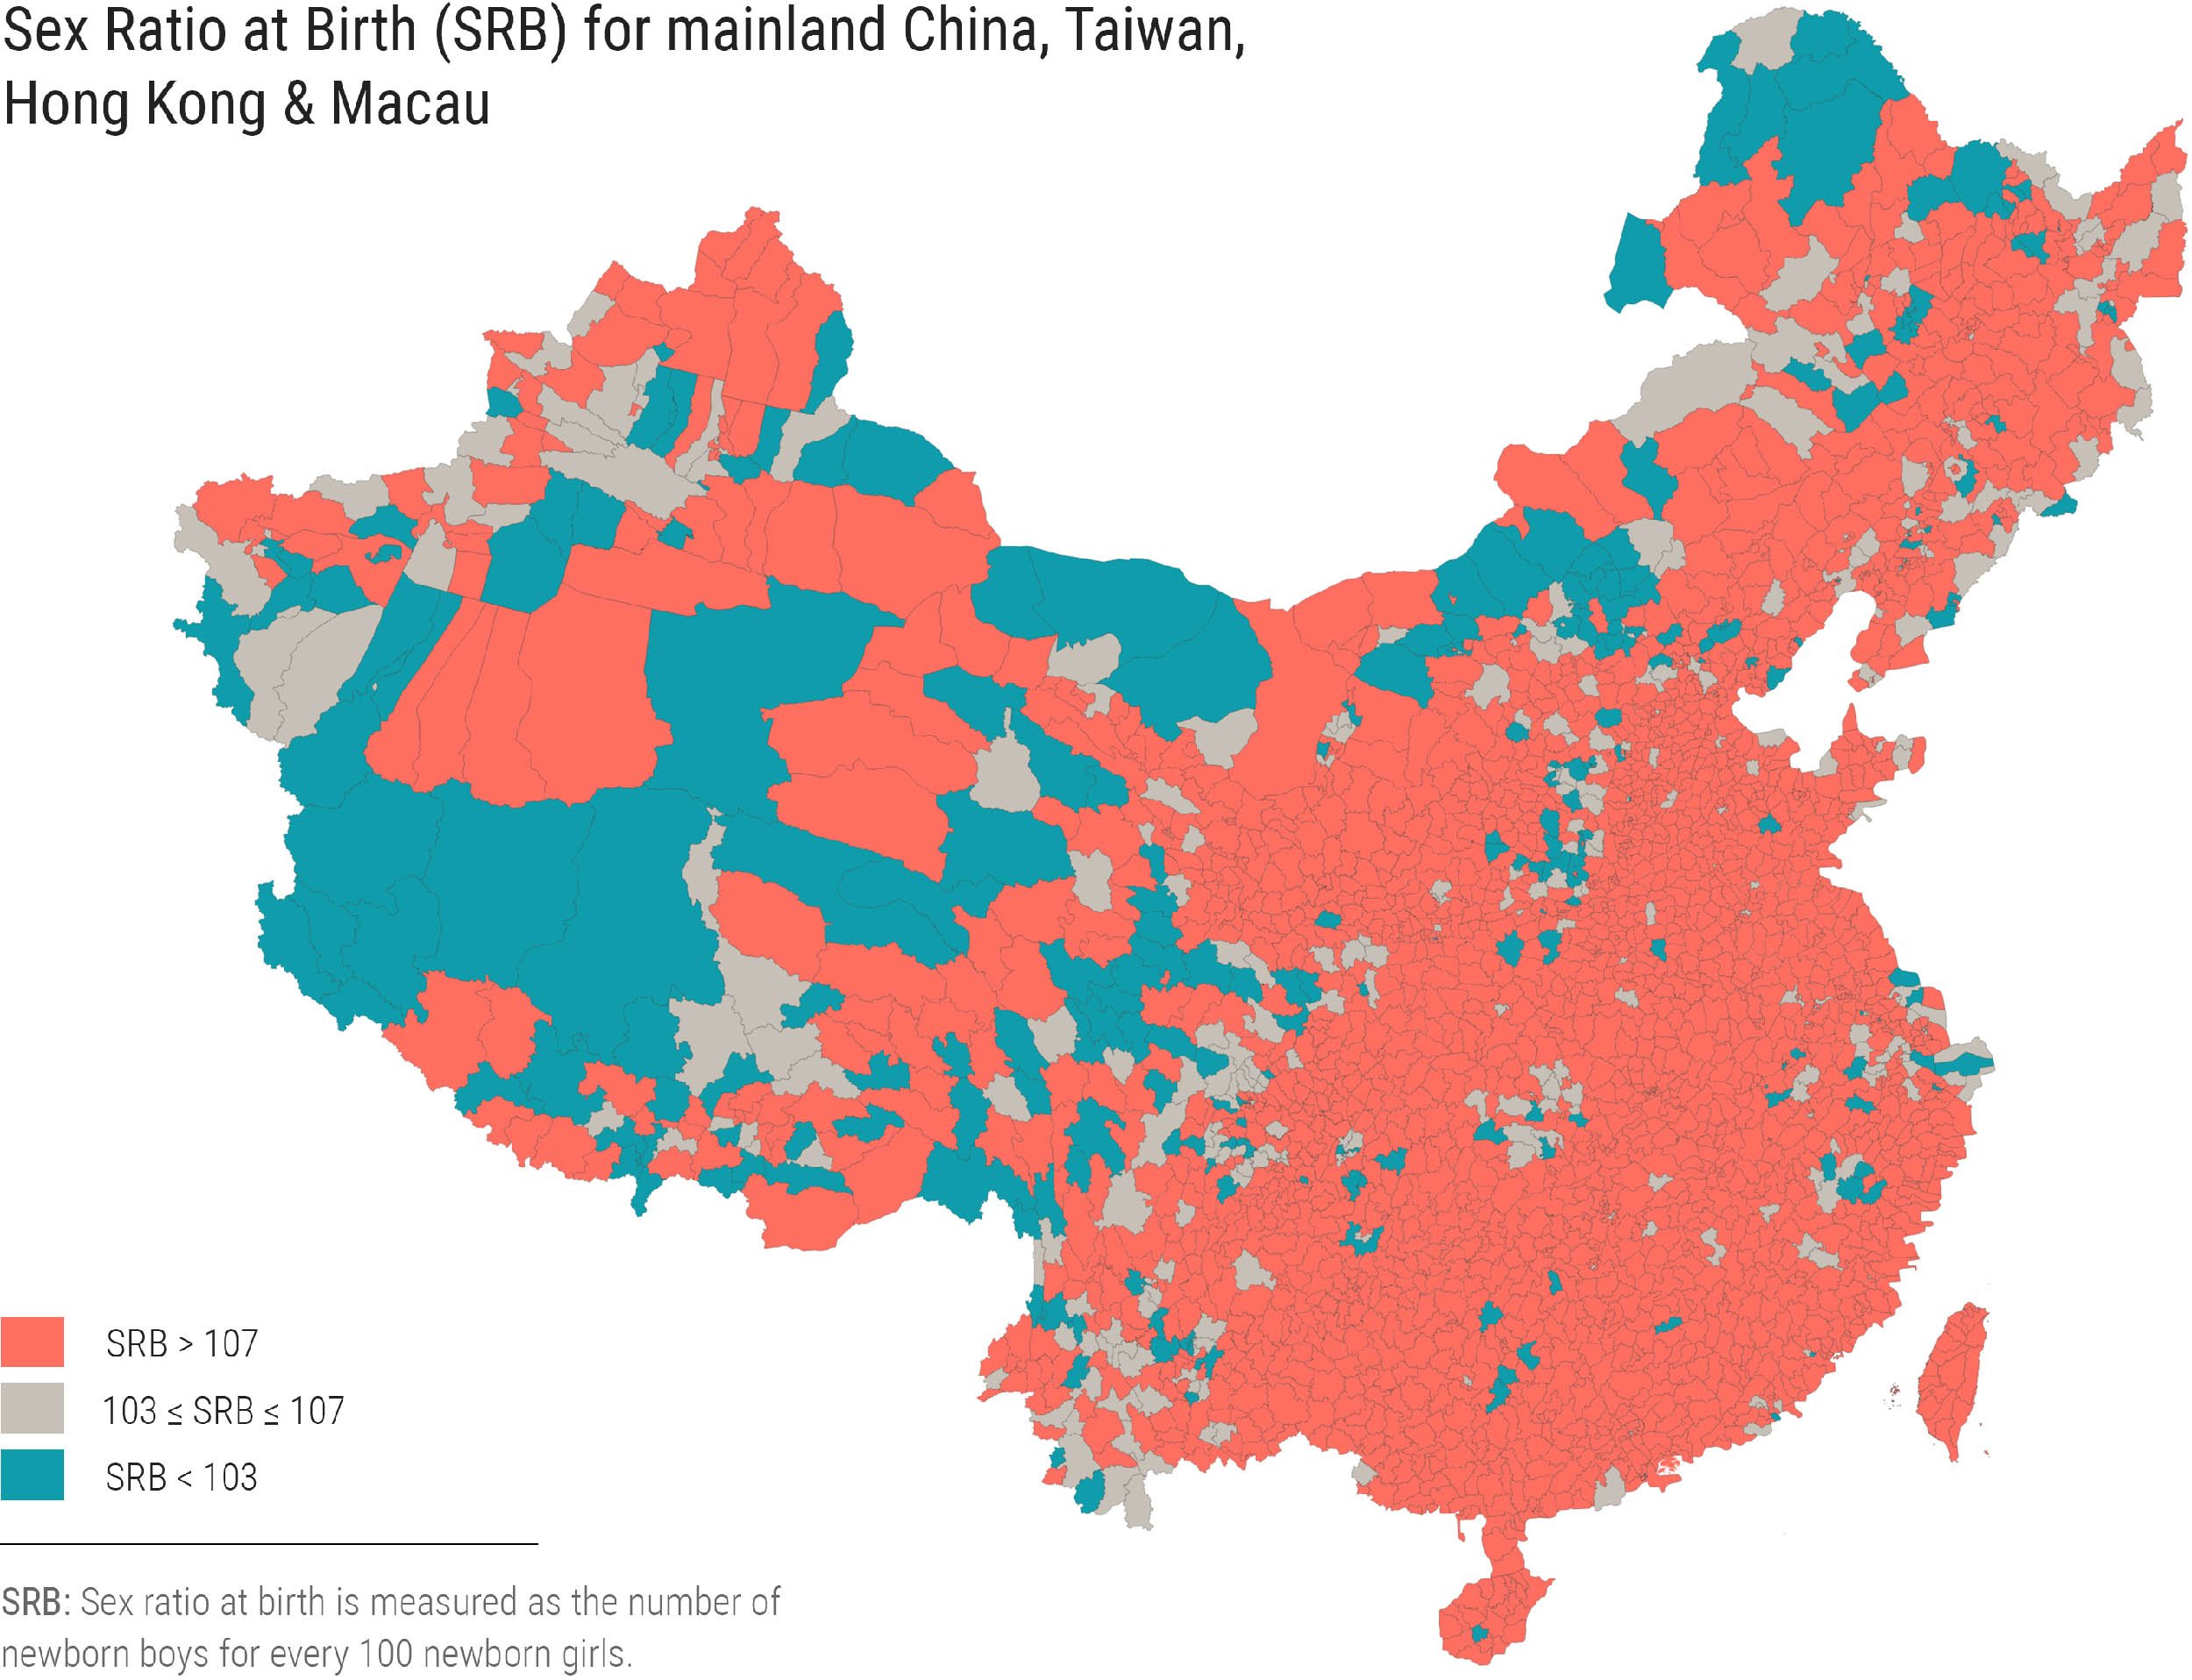
The first place to look is birth figures, known as SRB (Sex Ratio at Birth). Taking into account that male birth rates are slightly higher than those of women, the World Health Organisation considers the natural ratio to be between 103 and 107 male births for every 100 female births. We’ve mapped birth figures in the China region below, again at a county level. Counties with natural birth rates are coloured brown, those with high male birth rates (over 107:100) are red, and those with high female birth rates (below 103:100) are blue.

Display capital cities
A Sex Ratio at Birth of over 107 males per 100 females is an indication that the result is not naturally occurring – in other words, a result of gender selection practices such as sex-selective abortion. The exact natural range is debated, but the current figures for mainland China are clearly not a natural result. Our Chinese-sourced county level data shows 115.5 male births for every 100 female births for 2010 on the mainland, though others around that time calculated it at closer to 118. Either way, it’s likely the most lopsided ratio in the world (though Azerbaijan’s SRB has been calculated at 116, and Armenia’s at 115). Figures for Taiwan, Hong Kong and Macau are better but still slightly troubling, all coming in close to 109. Australia’s SRB, by contrast, falls in the higher end of the natural range at 106. Use of sex determination technologies and sex-selective abortion is illegal in China, but the data indicates it’s still widespread.
Very few counties we’ve mapped here lie in the range of natural SRB (103-107), or lower than 103. These are mostly in either most developed areas – the Yangtze Delta and Jingjinji Metropolitan Region, or the least developed areas – the Southwestern and Northwestern areas (e.g. Tibet, Xinjiang, Inner Mongolia and Yunnan). It’s not possible to determine the causes from these figures alone, but factors here could include the access to gender determination technologies (lower in less developed areas), cultural factors (Han Chinese majority areas have a higher proportion of men), and the fact that the wage-earning capacity of women is greater in urban areas.
The regions with an SRB less than 103 are harder to explain, though the average population of children under 1 year old in counties with SRB<102 was only 1858 (against an average of 13,028). This is certainly a large difference, which combined with the general remoteness of these areas might suggest that these figures are less accurate, less statistically significant – or perhaps that many more women really are born in smaller or more rural counties.
A preference for sons is common in many countries, and is nothing new in the Chinese-speaking world. Generally, men have had a higher wage-earning capacity, and women are expected to join their husband’s family (rather than vice versa) – which means that the family line and traditions are passed down through sons rather than daughters. In the case of China, this bias was definitely exacerbated by the one-child policy (which ran from 1979-2015), especially as it coincided with the more widespread availablity of sex determination technologies, especially ultrasonography.
For today’s eligible bachelors, this problem won’t be solved any time soon. But there are promising signs for the future. The most recent figures, in the range of 115-118 male births for every 100 female births, are by all reports a slight decrease – down from a high of 121:100 in 2005. With the end of the one-child policy and rising prosperity in China, trends are slowly pointing in the right direction.
Sophia Li: Research, data wrangling and data visualisation
Dan Kennedy: Article
Jack Zhao: Creative direction
Would a custom map help you present and understand your data? Get in contact.